How to Trade Using Fibonacci Levels
The Fibonacci indicator is very often used by traders when trading in the Forex market. Fibonacci levels are very versatile in their application, so it is not surprising that so many strategies include this indicator. Fibonacci levels are not just an indicator, there is a whole philosophical concept, behind which lies the mathematical justification. You probably know that a golden ratio is at the heart of many physical phenomena and the Fibonacci levels are different. The Fibonacci indicator is a very popular technical tool in the financial markets. Let’s see how you can trade based on Fibonacci levels and integrate this indicator into your trading.
Please note that Fibonacci levels should be drawn along the course of the price movement, if the price falls- from the top down, and if it grows, from the bottom up. A little more problematic is the selection of waves, because this is a subjective process. However, with practice this process will become easier and you will do it automatically.
The most common way to use Fibonacci levels is to determine the corrective movement. If you see that there was a pronounced trend in the market, but the price began to roll back, you can apply a grid of Fibonacci levels to the last pronounced wave, so you can predict the degree of market fluctuation versus the trend. The first corrective level will be 38.2%, then 50% and 61.8%. If the price goes below the Fibonacci level of 61.8%, you can expect a change in the trend to the opposite. Thus, we can predict the price movement against the trend and a possible reversal.
Very good Fibonacci levels work in conjunction with key price levels. Excellent entry points to the market are places where the Fibonacci levels match with the graphic models. Other technical analysis tools, such as moving averages, in combination with Fibonacci levels, can also perfectly confirm the trading signal.
If you see that the market is in disharmony with Fibonacci levels and graphic models, then it is better to refrain from trading, because instead of profit you will get losses, as you will work on noise movements. You should also not trade if you see contradictory signals, or disagreement between different technical elements. The stronger the correlation between technical indicators, the stronger the signal, and hence the transaction is more predictable, and vice versa.
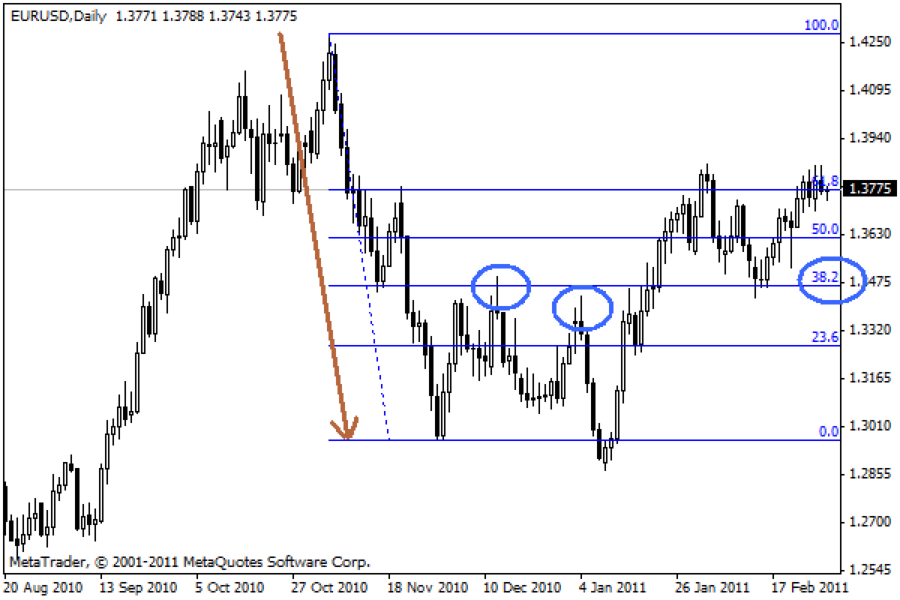
There are several ways of trading on Fibonacci levels. Let’s look at some of them. You saw a pronounced wave, and here the price begins to roll back, you draw the Fibonacci levels on the chart and wait. As mentioned earlier, the best way is to observe corrective levels of 38.2%, 50% and 61.8% and look for a trend entry point from these levels.
Look at the example, the price went down, then it began to roll back, we put the Fibonacci grid, and from 38.2% there appeared a candle pattern – a shooting star, this is the entry point to the market. The second input is not directly at the Fibonacci level but according to the trend.
In some cases, you may want to open a trade, but the stop loss will be too big. Here, too, we will need the Fibonacci levels. There are 2 ways: the first and the easiest is to draw the Fibonacci levels on that bar or candle, which is signaling for entering the trade and to hide the stop loss behind the level of 61.8%. If the price goes lower, then, most likely, the signal was false and will not work anymore. The chart below shows the absorption candle, the global trend upwards (this is not visible on this chart), if you put a stop loss behind the Fibonacci level, and not below the candle minimum, you can cut your stop loss almost twice.
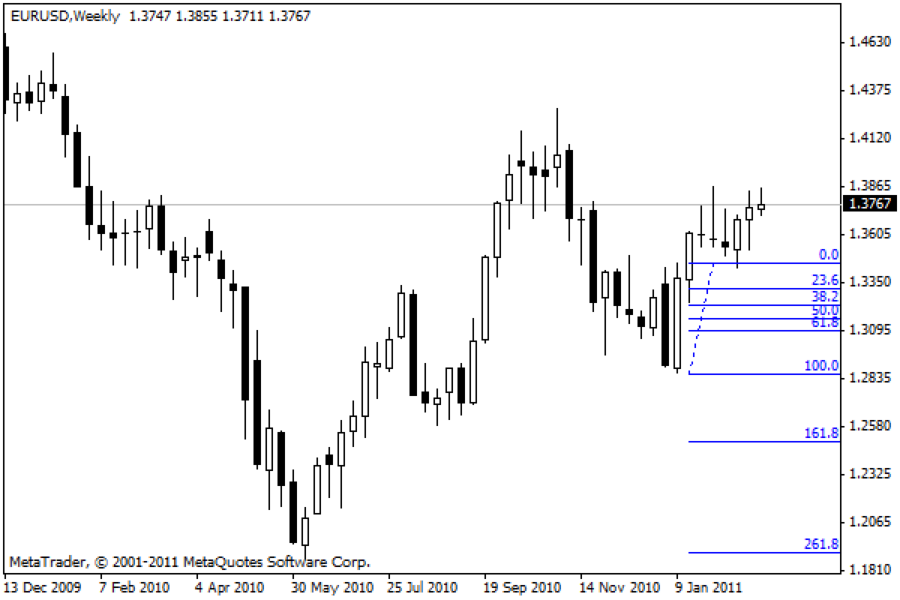
However, in this situation, we prefer a more complicated version of the trade entry. We also draw the Fibonacci grid on the signal candle, but we do not open a trade at the closure of this candle, but we put 2 pending buy orders from 38.2% and 50%. If the market rolls over, then we will get a very good price for our buy trades. Of course, there are situations when the price does not roll back, but continues to move on, and our pending orders will not be executed. In such cases we need to just wait for the next setup. It is better not to risk and keep the possible risk at a minimum.
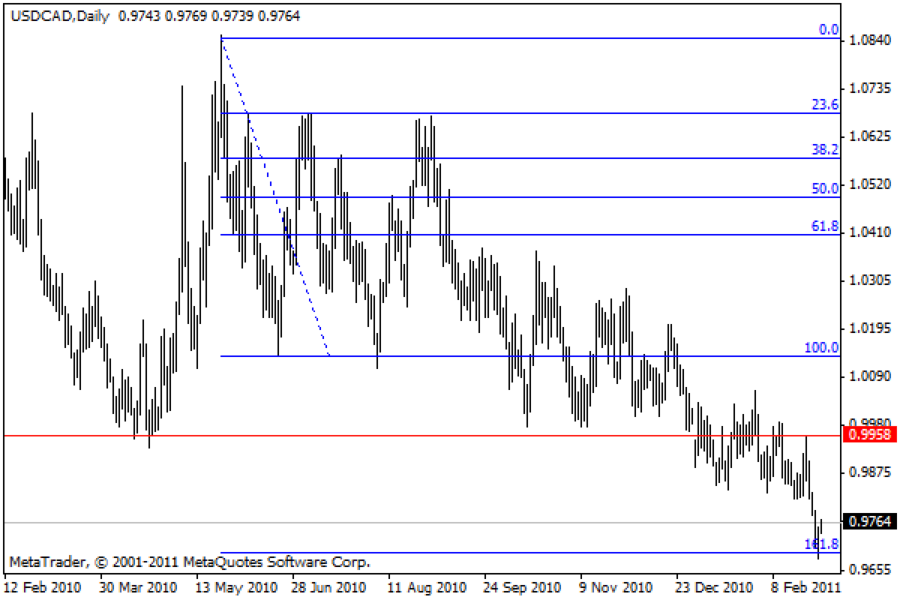
Sometimes a trader has a problem with determining the level of profit, especially when the pair is trading near its highs or lows. And here the Fibonacci levels come to our help. Only in this case we will draw the Fibonacci levels against the price movement. Of course, you can add the required levels in the indicator manually, but since 100% already have default extension levels, we do not complicate this process. Simply apply the Fibonacci grid on the chart.
As the example below shows, we were able to determine the first level for the profit -this is the red line of support. But, when the support was broken, we had a problem with determining the second take profit. The Fibonacci level of 161.8% was an excellent goal. So, if you do not know where to place the take profit, you can use the Fibonacci level of 161.8%.
That’s how you should apply the Fibonacci levels in your trading, but never rely only on them. It is always good to use a more complex approach that would include more indicators and strategies. This is how the best trading decisions have to be made.