Demystifying the Relative Strength Index (RSI) Indicator: A Complete Guide
In the world of technical analysis, the Relative Strength Index (RSI) is one of the most powerful and widely used momentum indicators by traders of all levels. Whether you’re new to trading or a seasoned pro, mastering the RSI can significantly improve your entry and exit timing, helping you avoid emotional trades and capture stronger trends.
In this article, we’ll break down what the RSI is, how it works, and how you can use it effectively across Forex, crypto, and stock markets. If you’ve ever felt confused or uncertain about how to interpret RSI readings—this is the ultimate guide you’ve been waiting for.
📘 What is the RSI Indicator?
The Relative Strength Index (RSI) is a momentum oscillator developed by J. Welles Wilder. It measures the speed and change of price movements and helps identify overbought and oversold market conditions.
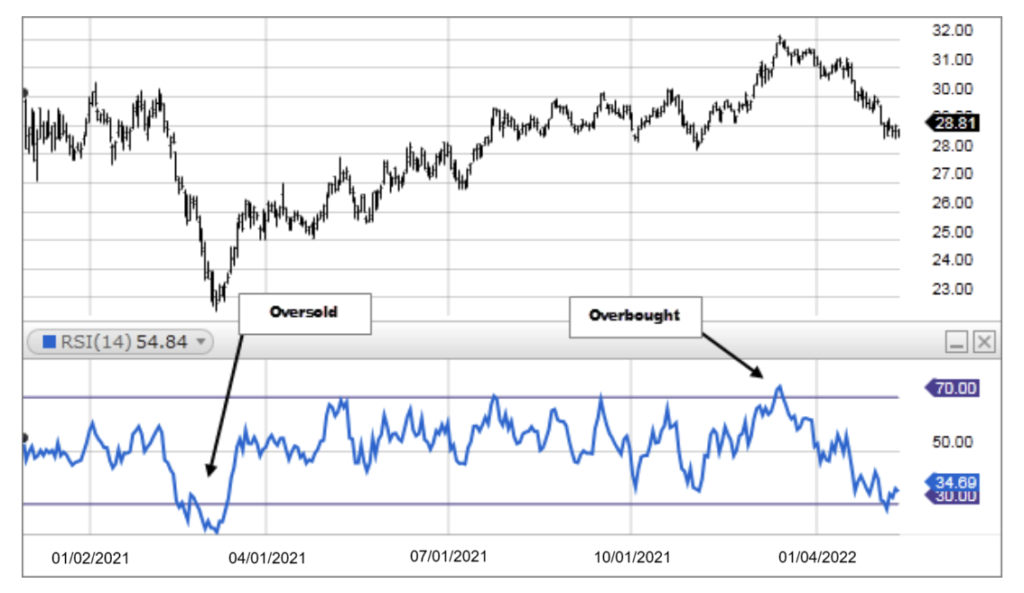
RSI values range from 0 to 100, and the indicator is typically used with a 14-period default setting.
• Above 70 = Overbought (potential sell zone)
• Below 30 = Oversold (potential buy zone)
But RSI is much more than just those two levels. It can be used for trend confirmation, divergence spotting, and even for spotting early signs of market reversals.
🔧 How Is RSI Calculated?
Although you don’t need to calculate RSI manually, understanding how it’s formed gives you an edge:
RSI = 100 – [100 / (1 + RS)]
Where RS = Average Gain of x periods / Average Loss of x periods
The RSI smooths out gains and losses over a chosen period (typically 14) and compares them to identify momentum strength.
📊 Interpreting RSI Readings
Here’s how traders interpret RSI values:
• 70–100: Overbought → Price may be due for a pullback
• 0–30: Oversold → Price may be due for a bounce
• 50: Neutral level → Often used as a trend confirmation line
• RSI Crossing 50 Upward: Potential bullish signal
• RSI Crossing 50 Downward: Potential bearish signal
But it’s important to understand: just because RSI hits 70 or 30 doesn’t mean the market will instantly reverse. RSI can remain in those zones during strong trends.
📈 RSI Trading Strategies
✅ 1. Overbought/Oversold Bounce Strategy
This is the most basic way to use RSI.
Buy Signal:
• RSI drops below 30 (oversold), then crosses back above it
• Confirm with bullish candlestick or support zone
Sell Signal:
• RSI rises above 70 (overbought), then crosses back below it
• Confirm with bearish candlestick or resistance area
📌 Best used in range-bound or sideways markets.
🔄 2. RSI Divergence Strategy
Divergences occur when price moves in one direction but RSI moves in the opposite. This is a strong early warning of a trend reversal.
• Bullish Divergence: Price makes lower lows, RSI makes higher lows
• Bearish Divergence: Price makes higher highs, RSI makes lower highs
This setup works best near support/resistance zones or after extended trends.
📉 3. RSI + Moving Average Filter
Combining RSI with a trend-following tool like the 50 or 200 EMA increases accuracy.
Strategy Example:
• Only take RSI buy signals when price is above 200 EMA
• Only take RSI sell signals when price is below 200 EMA
This helps you trade with the trend and filter out false reversals.
🔂 4. RSI Trendline Breakout
Draw trendlines directly on the RSI itself. When RSI breaks above/below those trendlines, it can signal momentum shifts before price reacts.
• Works well on H1, H4, or Daily timeframes
• Good for early breakout or breakdown entries
⚠️ RSI Limitations You Should Know
No indicator is perfect. Here are a few things to watch out for:
• False Signals in Trending Markets: RSI can remain overbought/oversold for a long time.
• Lagging Nature: As with most indicators, RSI is based on past price action.
• Need for Confirmation: Always use RSI with price action or other tools to confirm signals.
🔧 Custom RSI Settings for Different Strategies
• Day Traders/Scalpers: 5–7 period RSI = more responsive but more noise
• Swing Traders: 14 period RSI = standard, balanced for most setups
• Position Traders: 21–30 period RSI = smoother, less sensitive to short-term moves
You can also experiment with RSI levels (e.g., 80/20) instead of 70/30 if you’re trading strong trends.
📉 Real Chart Example (Insert Visual)
🎯 Final Thoughts: Should You Use RSI?
The Relative Strength Index is a versatile and easy-to-understand tool for traders of all levels. From identifying momentum shifts to confirming trends, RSI can give you the edge you need in fast-moving markets—if used correctly.
The key is to not rely on RSI alone. Combine it with price action, support/resistance, and trend filters for best results. With time and practice, RSI can become a core part of your trading system in 2025 and beyond.
📌 Want Help Using RSI in Real Markets?
Join our Smart Forex Pips VIP Trading Community where we share daily signals, chart analysis, and real-time strategy setups—including how and when to use RSI for maximum effect.