Mastering Elliott Wave Theory in Forex Trading
Elliott Wave Theory is one of the most powerful and widely used methods of technical analysis in Forex trading. Developed by Ralph Nelson Elliott in the 1930s, the theory is based on the idea that market prices move in repetitive cycles influenced by investor psychology. Understanding and mastering Elliott Wave Theory can provide traders with valuable insights into market trends, helping them make informed trading decisions.
Understanding Elliott Wave Theory
Elliott Wave Theory suggests that price movements follow a predictable pattern consisting of two main phases:
- Impulse Waves (Trending Moves): Consist of five waves moving in the direction of the primary trend.
- Corrective Waves (Counter-Trend Moves): Consist of three waves that move against the primary trend.
This wave structure helps traders anticipate market trends and identify potential trading opportunities.
The Five-Wave Impulse Pattern
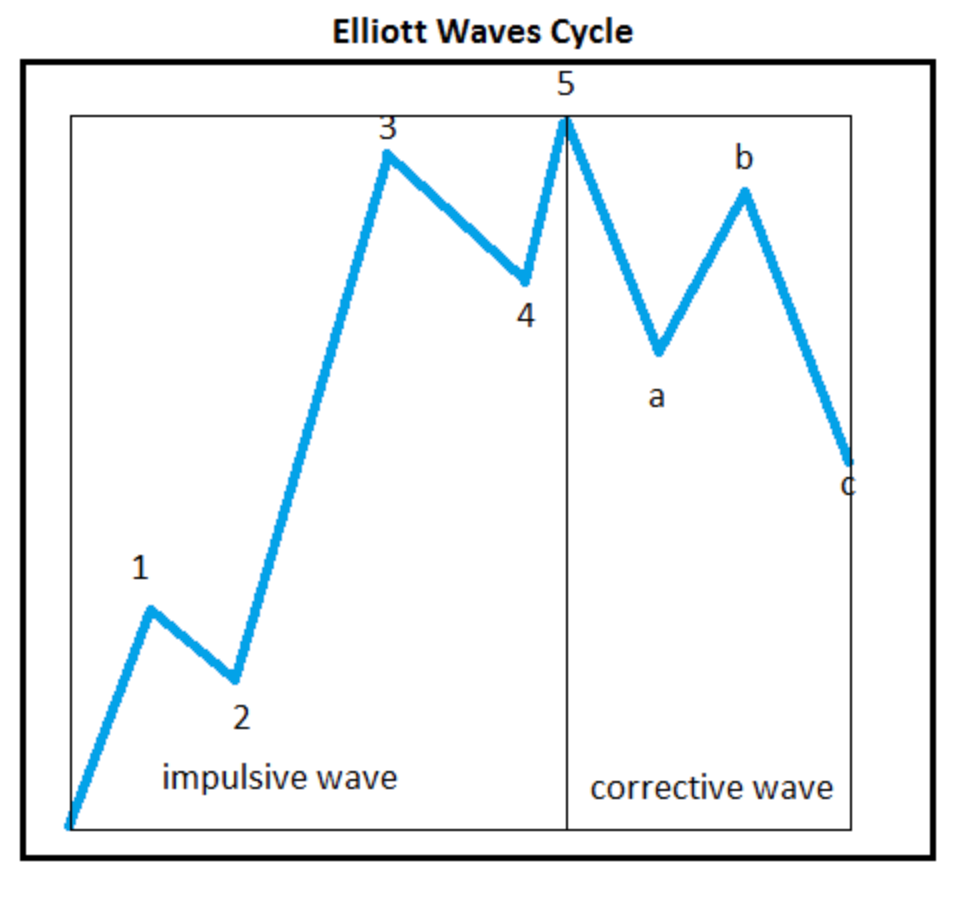
The impulse wave is the driving force behind a market trend and consists of five distinct waves:
- Wave 1: A small price movement in the direction of the new trend. At this stage, few traders recognize the new trend.
- Wave 2: A pullback or correction as some traders take profits. However, it does not retrace the entire previous wave.
- Wave 3: The longest and strongest wave, driven by strong market participation. This is often where big institutional traders enter.
- Wave 4: Another corrective phase, but it does not overlap with Wave 1. It is usually a consolidation phase.
- Wave 5: The final push in the direction of the trend, often driven by retail traders who enter late. After this wave, a market correction is expected.
The Three-Wave Corrective Pattern
The corrective wave consists of three smaller waves labeled A, B, and C:
- Wave A: The initial counter-trend movement, signaling that the trend may be weakening.
- Wave B: A temporary reversal back toward the previous trend.
- Wave C: A final move that completes the correction before the primary trend resumes.
Applying Elliott Wave Theory in Forex Trading
1. Identifying Waves in Real Charts
Traders use various tools such as Fibonacci retracements and trendlines to identify Elliott Wave structures on charts. A typical approach includes:
- Recognizing a strong Wave 3, which is often the easiest to spot.
- Using Fibonacci retracement levels to estimate the depth of corrective waves.
- Looking for confirmation signals from indicators like RSI and MACD.
2. Trading Strategies Using Elliott Waves
- Trend Trading: Entering a trade during Wave 3 when momentum is high.
- Pullback Trading: Entering after a corrective Wave 2 or Wave 4 using Fibonacci retracement levels.
- Reversal Trading: Identifying the completion of a five-wave pattern and preparing for the corrective phase.
3. Example of Elliott Wave Application
Suppose the EUR/USD pair is in an uptrend and you identify the following pattern:
- Wave 1: A small rally from 1.1000 to 1.1200.
- Wave 2: A pullback to 1.1100.
- Wave 3: A strong push to 1.1500.
- Wave 4: A consolidation at 1.1400.
- Wave 5: A final rally to 1.1600. After this, you anticipate a corrective A-B-C wave and adjust your trades accordingly.
Conclusion
Mastering Elliott Wave Theory requires practice and experience, but it provides traders with a structured approach to analyzing market trends. By identifying wave patterns, traders can anticipate price movements, set effective entry and exit points, and enhance their overall trading performance. However, no trading strategy is foolproof, so combining Elliott Wave analysis with other technical and fundamental tools can improve its effectiveness. Happy trading!