
Fair Value Gap (FVG) Trading Strategy: How to Use It on Gold and EURUSD

You’ve watched price rally sharply, leaving a gap on the chart below the move. Then a few hours later — sometimes a few days later — price retraces back into that exact zone, pauses, and continues higher. You’ve seen this pattern dozens of times but never had a name for it or a method to trade it consistently.
What you were watching was a fair value gap playing out. And once you understand why it forms and how to qualify which ones are worth trading, it becomes one of the most precise, repeatable setups available on XAUUSD and EURUSD.
This guide covers everything: what a fair value gap is, the institutional logic behind it, how to identify bullish and bearish FVGs on a live chart, how to combine them with your existing SMC framework, and a complete trading strategy with entry, stop loss, and target rules.
What Is a Fair Value Gap?
A fair value gap (FVG) is a three-candle price formation that occurs when the market moves so rapidly in one direction that it skips through a price range without trading efficiently. The result is a zone on the chart where buyers and sellers never had the opportunity to transact at fair prices — an imbalance left behind by institutional order flow.
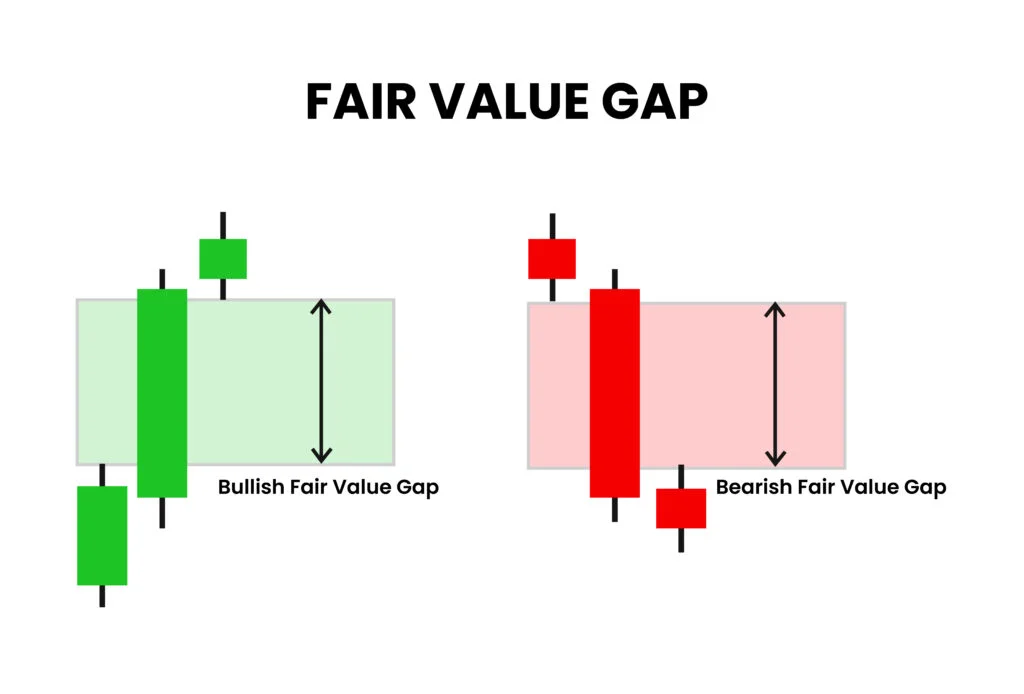
Here is the exact structure:
- Candle 1: Any candle moving in the current direction
- Candle 2: A large, strongly impulsive candle that drives price aggressively in one direction — this is the institutional candle
- Candle 3: A candle that continues the move and opens beyond candle 2
The fair value gap is defined as the price zone between the high wick of candle 1 and the low wick of candle 3 (for a bullish FVG), or between the low wick of candle 1 and the high wick of candle 3 (for a bearish FVG). The key is that candle 1 and candle 3’s wicks do not overlap — that non-overlapping zone is the imbalance.
In ICT terminology, the midpoint of the FVG is called the Consequent Encroachment (CE) — the 50% level of the gap. This midpoint is one of the most significant price levels in the entire FVG framework and plays a central role in entry timing, which we cover in the strategy section below.
Note: A fair value gap is not the same as a standard price gap between a market close and the next open. FVGs are intraday structures that form within a continuous price feed — they are identified wick-to-wick across three candles, not session-to-session.
Why Fair Value Gaps Form: The Institutional Logic
To understand why FVGs are tradeable, you need to understand what creates them.
When a large institution — a central bank, a major hedge fund, or a bullion desk — needs to place a significant position, it cannot do so all at once without immediately moving the market against itself. So it does two things: it accumulates orders gradually in a defined range, and then at a specific trigger point, it releases a large market order that drives price through multiple levels at high velocity.
That high-velocity move is what creates the FVG. Price moves so fast that the order books at those price levels are never fully matched — buyers and sellers who wanted to transact in that zone simply didn’t have time to do so. The gap represents unfinished business: a price area where the market owes a balancing of supply and demand.
This is why price returns to FVGs. It’s not a mystical magnet or a self-fulfilling pattern. It’s the mechanical consequence of unfilled orders resting in that price zone. When price revisits the FVG, those resting institutional orders get triggered — and that reaction is what traders use for entries.
This dynamic applies to both XAUUSD and EURUSD — two of the most institutionally dominated instruments in the world. Both markets are driven by large players whose order footprints appear consistently on the chart as FVGs, particularly during the London and New York sessions when volume and participation are highest.
If you’re not yet familiar with how session timing affects these setups, our guide on the best time to trade XAUUSD covers London and New York session dynamics in detail — including exactly when FVGs are most likely to be tested.
Bullish Fair Value Gap: How to Identify It
A bullish FVG forms during an upward impulse. Here’s exactly what to look for:
What it looks like on the chart: Price is trending upward. A large bullish candle drives price higher aggressively. The candle before it had a high wick at a certain level. The candle after it opens above that level and continues higher, with its low wick sitting above the high wick of the pre-impulse candle. The zone between those two wick extremes — above candle 1’s high wick and below candle 3’s low wick — is the bullish FVG.
Why it matters: That gap sits below current price, in the wake of an upward impulse. When price retraces downward into this zone, it’s returning to an area of institutional demand — where unfilled buy orders are still resting. The expectation is that price reacts bullishly inside the FVG and continues the upward move.
A real XAUUSD scenario: Gold is in an intraday uptrend on the H1 chart. At 9:00 AM GMT during the London open, a large bullish candle drives price from $2,295 to $2,318 in a single bar. The previous candle’s high wick was at $2,296. The next candle after the impulse has a low wick at $2,311. The zone from $2,296 to $2,311 is the bullish FVG. When gold retraces back to this zone later in the session, that is your entry window.
Bearish Fair Value Gap: How to Identify It
A bearish FVG is the mirror image, forming during a downward impulse.
What it looks like: A large bearish candle drives price downward aggressively. The candle before it had a low wick at a certain level. The candle after it opens below that level and continues lower, with its high wick sitting below the low wick of the pre-impulse candle. The zone between the low wick of candle 1 and the high wick of candle 3 is the bearish FVG.
Why it matters: That gap sits above current price, in the wake of a downward impulse. When price rallies back up into this zone, it’s entering an area of institutional supply — where unfilled sell orders are resting. The expectation is a rejection inside the FVG and continuation downward.
A real EURUSD scenario: EURUSD is selling off on the H4 chart following a bearish market structure break. A large red candle drops price from 1.0855 to 1.0812. The previous candle’s low wick was at 1.0850. The next candle’s high wick is at 1.0831. The zone from 1.0831 to 1.0850 is the bearish FVG. When price rallies back into that zone, you’re looking for short setups with a stop above 1.0850 and targets at the prior swing lows.
The Complete FVG Trading Strategy
Spotting the gap is step one. Trading it profitably requires a structured approach. Here is the full framework used in the Smart Forex Pips daily analysis.
Step 1: Higher Timeframe Bias First — Always
This is the most important rule and the one most beginners skip entirely. Never trade an FVG in isolation.
Before scanning for FVGs on the H1 or M15 chart, check the H4 or D1 chart. Is the market making higher highs and higher lows? You’re in an uptrend — only trade bullish FVGs. Making lower highs and lower lows? Downtrend — only trade bearish FVGs.
An FVG that contradicts the higher timeframe trend has a much lower probability of holding. The gap might look textbook-perfect on a lower timeframe, but without directional alignment, you’re trading against the dominant flow of institutional money.
For a deeper understanding of how to read market structure before applying FVGs, our guide on Smart Money Concepts explained walks through structure, BOS, and trend identification from scratch.
Step 2: Qualify the FVG — Apply All Four Filters
Not every three-candle imbalance deserves a trade. These four filters separate high-probability setups from noise:
Filter 1 — It must be fresh (unmitigated). An FVG is mitigated once price has already returned to and traded through the full zone. Once mitigated, the institutional orders there are filled and the zone loses its pull. Only trade the first-touch retest of an FVG — never a second or third visit.
Filter 2 — The impulse candle must be genuinely strong. A valid FVG requires a standout candle — not a marginally above-average move. The impulse should be visually obvious on your chart. If you’re unsure whether the middle candle qualifies, it probably doesn’t.
Filter 3 — It must follow a Break of Structure (BOS). The impulse move creating the FVG should break a prior swing high (bullish) or swing low (bearish). An FVG that doesn’t break structure is part of a correction, not a directional move, and is far less reliable.
Filter 4 — It must sit in a premium or discount zone. In ICT methodology, the optimal approach is buying in discount (below the 50% retracement of the current swing range) and selling in premium (above the 50%). A bullish FVG sitting in a discount zone is significantly stronger than the same pattern at the top of a range. This filter alone eliminates the majority of low-quality setups.
Step 3: Wait for the Retest — Never Chase the Impulse
After the FVG forms, be patient. You don’t enter during the impulse candle. You wait for price to pull back into the zone. That retracement is your entry opportunity.
Watch how price behaves as it enters the FVG. On a lower timeframe (M5 or M15), look for:
- A wick rejection from inside the gap
- A Change of Character (CHoCH) — a small structure shift on the lower timeframe confirming the reversal
- Price holding above the CE midpoint for bullish FVGs, or below the CE for bearish
Step 4: Entry Approaches
Two approaches, from aggressive to conservative:
Limit order at the CE (50% midpoint of the FVG). The midpoint consistently shows the highest reaction probability. Place a buy limit at the CE for bullish setups, sell limit for bearish. This maximises entry price and risk-to-reward ratio.
Lower timeframe CHoCH confirmation. Drop to M5 or M15 and wait for a structural confirmation — a small break of structure in the direction of your trade — before entering. This is slightly more conservative and reduces the risk of being caught in a gap that fails before reacting.
Step 5: Stop Loss Placement
Your stop goes just beyond the full FVG zone — not inside it.
For a bullish FVG: stop a few pips below the low wick of candle 1 (the absolute bottom of the gap). If price closes below this level, the FVG is fully mitigated and the setup is invalidated.
For a bearish FVG: stop a few pips above the high wick of candle 1 (the top of the gap).
Never place your stop inside the zone. Price will frequently wick through portions of the gap before reacting — this is normal FVG behaviour. A stop inside the zone gets taken out by mechanics, not by a genuine failure of the setup.
Step 6: Targets and Risk-to-Reward
Set take profit at the next significant liquidity pool in the direction of the trade. For bullish setups: prior swing highs, session highs, or visible equal highs above price. For bearish: prior swing lows, session lows, or equal lows below.
Target a minimum of 1:2 risk-to-reward. Clean FVG setups on H1 XAUUSD — particularly during the London Kill Zone (8:00–10:00 AM GMT) or the New York open overlap — regularly produce 1:3 or better when properly aligned with the higher timeframe structure.
For a complete session timing guide and how it affects FVG setup quality, see: Best time to trade XAUUSD — London vs New York sessions explained.
The Highest-Probability Setup: FVG + Order Block Confluence
A qualified FVG on its own is a strong setup. When it overlaps with an order block, the combination is the highest-conviction configuration in the SMC framework.
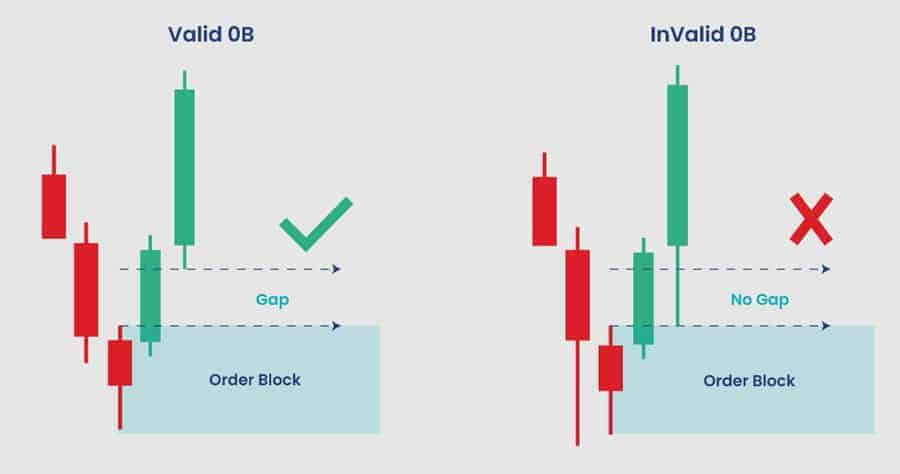
Here’s why: an order block represents an institutional accumulation zone — where large orders were placed before an impulse move. A fair value gap often forms during that same impulse. When the OB and FVG share the same price zone, you have two independent sources of institutional activity converging at one level: the unfilled accumulated orders of the OB and the price imbalance of the FVG.
On XAUUSD, when a fresh bullish FVG sits within or directly overlaps a bullish order block — both in a discount zone, both aligned with the H4 uptrend — that is the highest-conviction long setup available in the SMC methodology. These are the setups worth sizing up on, and they appear multiple times per week on gold during the London and New York sessions.
For a full breakdown of how to identify and trade order blocks, see our guide: What is an order block in forex? SMC guide for beginners.
FVG + Fibonacci Confluence
A second powerful combination is FVG + Fibonacci retracement. When an FVG aligns with the 50% or 61.8% Fibonacci retracement of the most recent swing move, the probability of a reaction increases substantially.
The 61.8% level carries particularly strong confluence because it sits deep enough in the discount zone to attract institutional interest while still falling within the FVG’s range. On EURUSD specifically, FVG + 61.8% setups at the London open are among the cleanest and most consistent intraday trade structures available.
Choosing the Right Broker to Trade FVG Setups
A reliable FVG entry depends heavily on execution quality. Because FVG trades often involve tight stops — just beyond the zone boundary — spreads and slippage matter more than with wider stop strategies.
For XAUUSD and EURUSD FVG trading, you need a broker with:
- Raw or near-zero spreads during the London and New York sessions
- Fast MT4/MT5 execution with no requotes
- Regulation from a tier-1 authority (FCA, ASIC, CySEC)
BestForexInvest has independently reviewed and ranked the top regulated forex brokers for 2026, with specific coverage of spreads, execution speed, and platform quality across MT4 and MT5. Their top brokers list is a practical starting point if you’re looking to find or switch to a broker suited to SMC-style trading.
Common FVG Mistakes to Avoid
Trading every gap you see. Most FVGs are noise. Apply all four filters — fresh, strong impulse, post-BOS, discount/premium zone — before considering any setup. These filters eliminate the majority of low-quality gaps.
Ignoring session timing. An FVG tested during the Asian session in low-volume conditions is far less reliable than the same setup tested during the London Kill Zone or NY open. Institutional order flow — the fuel that makes FVGs react — is concentrated in specific session windows.
Entering during mitigated gaps. Once price has traded through an FVG, it’s done. Stop marking it as a zone of interest. A clean, fresh, unmitigated FVG is the only kind worth trading.
Widening stops inside the gap. When price enters an FVG and doesn’t react immediately, the instinct is to give it more room. Resist. If price closes fully through the entire zone, the setup is invalidated. Honour the pre-defined stop, accept the loss, and move on to the next setup.
Skipping the higher timeframe check. FVGs work with institutional flow, not against it. Trading a bearish FVG when the daily chart is in a strong uptrend is how small stop losses turn into account-damaging trades.
For a broader framework on protecting your account while trading setups like this, BestForexInvest’s forex risk management guide covers position sizing, drawdown control, and risk-per-trade rules in detail.
Why XAUUSD and EURUSD Produce the Cleanest FVGs
Both gold and EURUSD generate exceptionally clear, tradeable FVGs for the same core reason: institutional dominance. The bullion banks on XAUUSD and the major interbank desks on EURUSD are exactly the kind of players whose large-volume orders create the standout impulse candles that form textbook FVGs.
XAUUSD particularly benefits from its daily range. A gold FVG on the H1 chart might span 15–25 pips — enough room for a properly placed stop while targeting 45–80 pips to the next liquidity pool. The risk-to-reward arithmetic is favourable in a way that tighter-ranging pairs simply can’t match consistently.
EURUSD produces FVGs with extremely precise structure, particularly on the H4 and H1 timeframes. Because EURUSD is the world’s most liquid pair, institutional flow at the London and New York opens is consistent and measurable — producing FVGs that respect their zone boundaries with a reliability that is difficult to find on less-traded pairs.
At Smart Forex Pips, every daily analysis includes the active FVGs on both XAUUSD and EURUSD — whether they’re fresh, which session is most likely to bring price back to test them, and whether the confluence with order blocks or Fibonacci justifies a trade. This analysis is published every morning before the London open.
Join the free Smart Forex Pips Telegram channel → HERE
And if you want fair value gaps plotted automatically on your TradingView charts alongside order blocks and key session levels, the Smart Forex Pips indicator does exactly that — updated in real time.
Get the Smart Forex Pips TradingView indicator → HERE
Summary
A fair value gap is a three-candle price imbalance created when institutional order flow drives price so rapidly through a zone that supply and demand never balanced there. Bullish FVGs form below impulsive upward moves. Bearish FVGs form above impulsive downward moves.
The strategy: establish higher timeframe bias first. Qualify the FVG using all four filters — fresh, strong impulse, post-BOS, discount or premium zone. Wait for the retest. Enter at the CE midpoint or on a lower timeframe CHoCH. Stop beyond the full gap. Target the next liquidity pool at a minimum 1:2 risk-to-reward.
Add order block or Fibonacci confluence and you have the most consistent, repeatable trade structure in Smart Money Concepts trading — applied to the two instruments that produce it most cleanly.
Risk disclaimer: Trading forex and gold involves significant risk and may not be suitable for all investors. Past performance is not indicative of future results. This article is for educational purposes only and does not constitute financial advice. Between 72–89% of retail CFD accounts lose money. Never trade with money you cannot afford to lose.